RESEARCH + SYSTEM MAPPING
Music Consumption
How might we better understand consumption of music through streaming platforms, including current discourse regarding artist compensation?
Interested in understanding how streaming platforms like Spotify are reshaping music consumption and impacting artist compensation, we embarked on a multi-phase project. First, we investigated and mapped Spotify's payment model, revealing a complicated and sometimes uneven distribution of royalties. Second, we conducted user interviews to explore music consumption habits and awareness of artist compensation. Third, we built a system map to untangle the intricate web of devices, actors, networks, and representations that drive Spotify's value flow. While our initial aim was to advocate for fairer artist pay, the project evolved into a deeper exploration, reminding us of the humility and patience required to navigate complex systemic issues.
PARSONS, NEW ECONOMIES AND SOCIETIES, 2023
Group Project, Master of Science degree in Strategic Design and Management
ROLES
Researcher, Strategist
TEAM
Abbey Manliclic
Design Process
Phase One: Secondary Research
Surveyed existing resources on the music industry and streaming including journal articles, news pieces, Spotify’s data, and the work of the Union of Musicians and Allied Workers.
Delivery: Spotify Unwrapped - How the money flows
Our first artifact was a map (above) of the payment flow under Spotify’s current “streamshare” model, which is a pro-rata payment model. The map illustrates how various parties take a share of the royalties before it reaches artists and songwriters.
The map made visible the reality that the distribution of music royalties is often lopsided, with record labels and streaming platforms like Spotify receiving a significant share.
Early sketch of the ecosystem.
Phase 2: Primary Research
Research Focus: Music consumption habits, with a focus on streaming and awareness of discourse regarding artist compensation.
Process
Identified interview objectives and determined research questions
Conducted 30-45 minute 1-on-1 interviews via Zoom or in-person
Compiled research notes summaries and analyzed trends and themes
Delivery
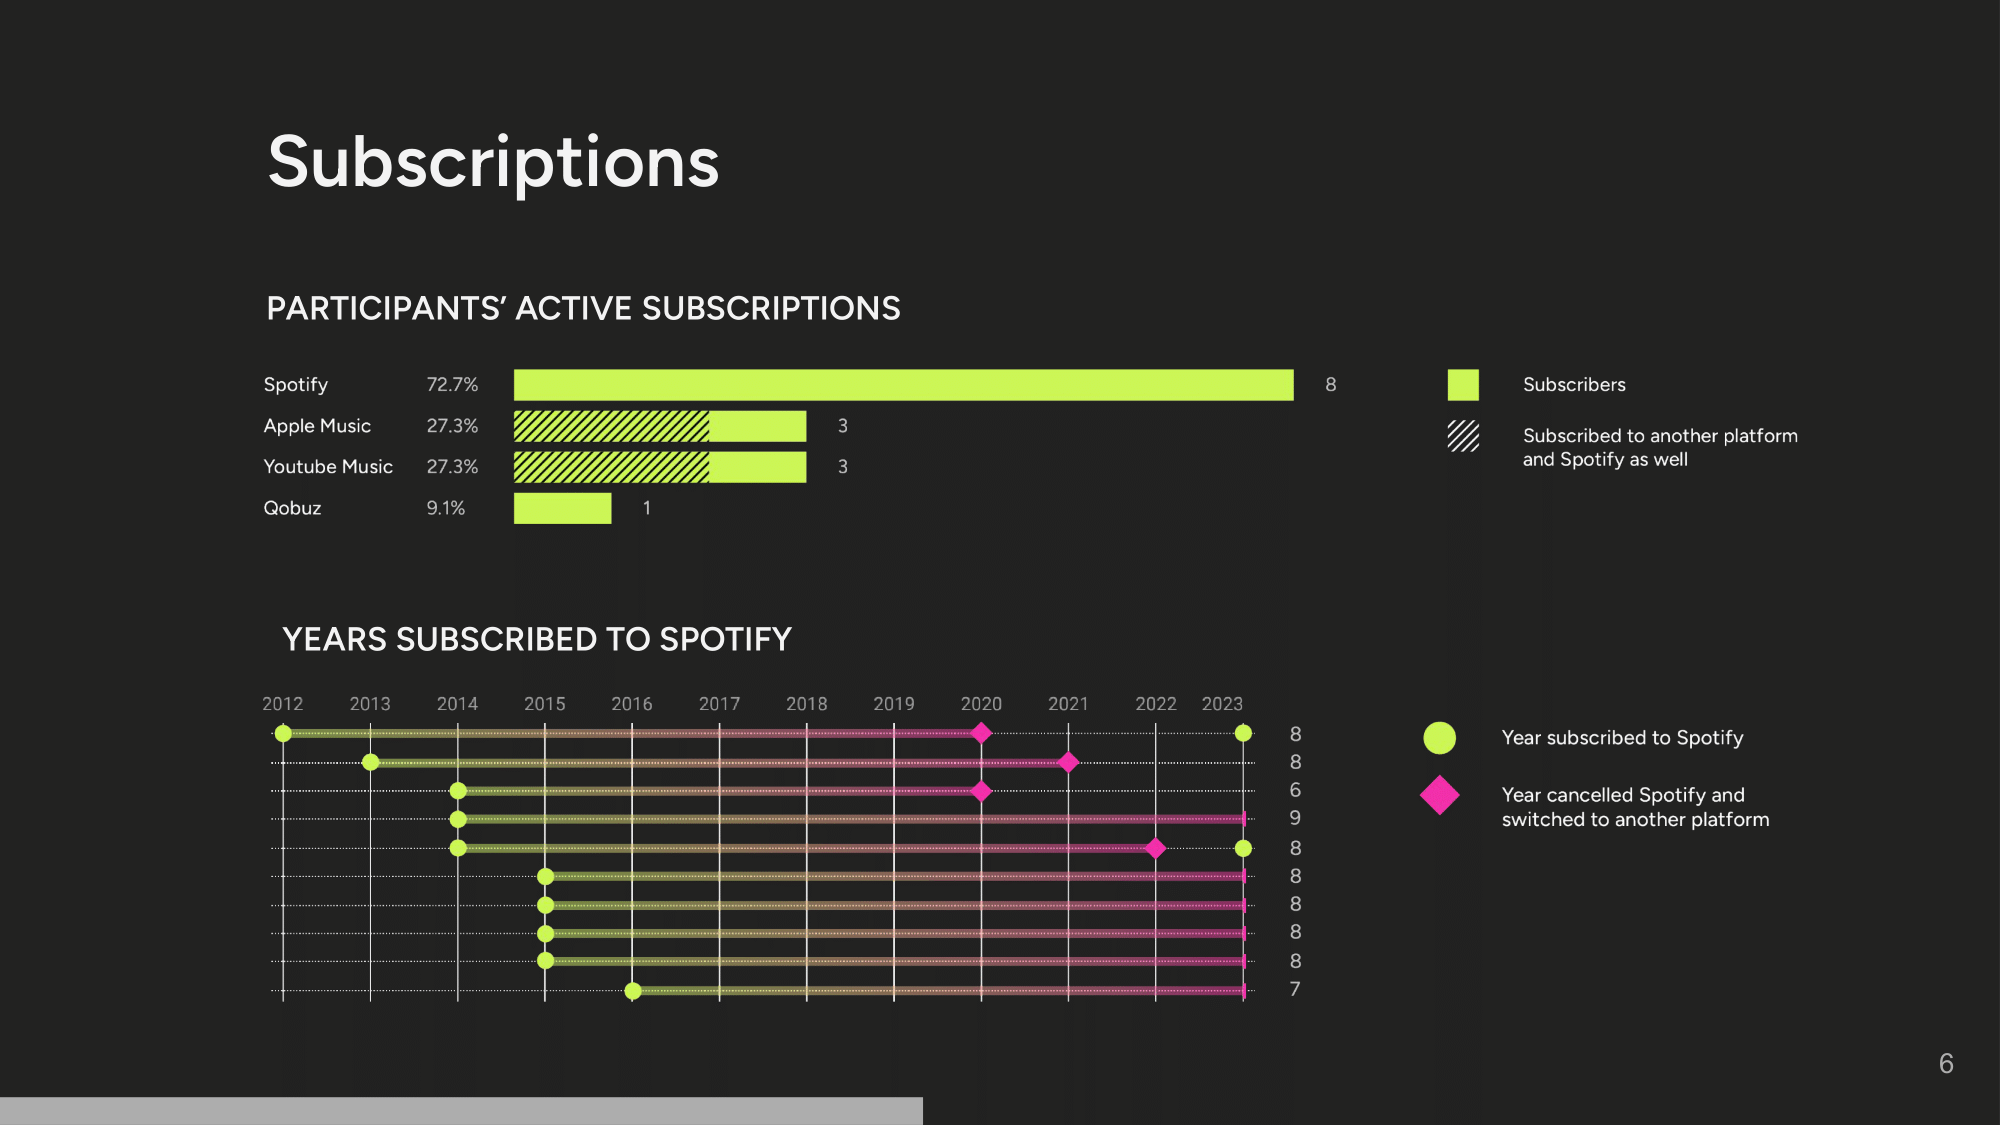
Presentation on research findings:
Phase 3: System Mapping
Our research suggested that even among those in the music industry, the industry and economy of streaming and Spotify were not well understood. We created an interactive system map of Spotify’s value flow.
Method
We decided to use a DARN approach because understanding the economization of a platform like Spotify requires digging into the complex devices, actors, representations, and networks involved. DARN also allows for fluid categorization with an appreciation of context and distributed agency.
Delivery
Spotify DARN System Map (click here to explore the map)
Categorization of Devices, Actors, Networks, and Representations
Descriptions and definitions of each node
Six Highlighted DARN Relationships
Artist-Record Holder Relationship
Spotify-Artist Payout Model
Spotify Revenue Stream
TikTok-Spotify Pipeline
Spotify Discovery Algorithm
Tech Access to Spotify
Introduction and overview of the Spotify DARN System Map.
Lessons Learned
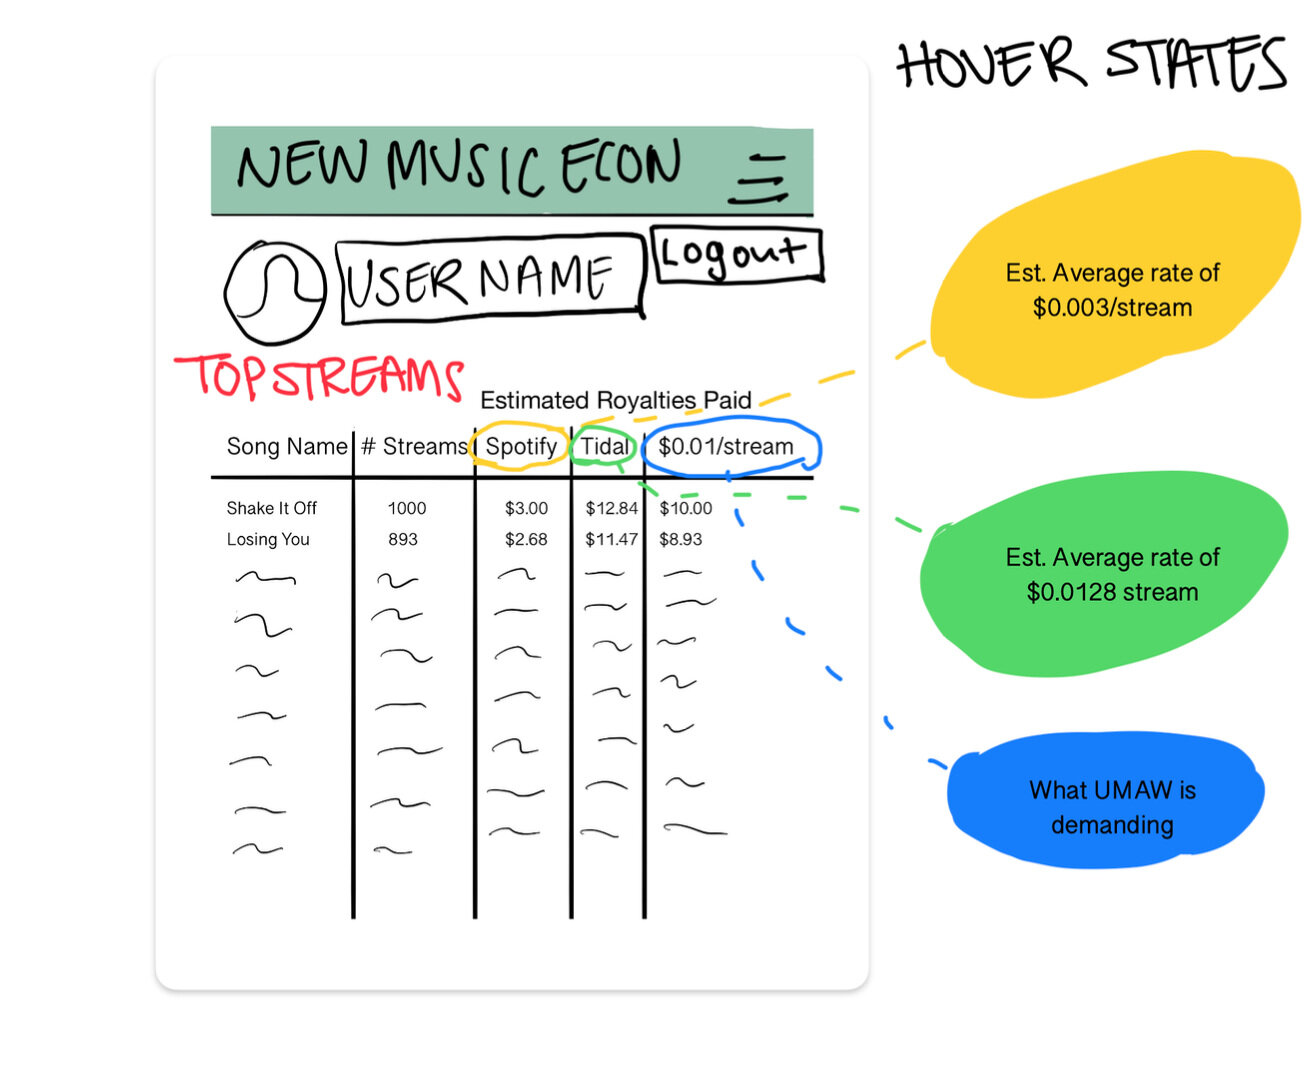
This project was a lesson in navigating complexity and the humility and patience that designing around complex problems requires. When we began this project, we were hoping to contribute to solving the problem of artists being underpaid by streaming platforms like Spotify. Early on, we even had a prototype of a website that would show Spotify users how much more the artists they listened to would be paid if they switched to Tidal or other platforms (below). As we conducted research and learned more about the payment models, users’ motivations and behaviors, and the industry as a whole, it became clear that meaningful interventions would first require deeper understanding and sense-making on our part.
Sketch of our early proposal, a website showing Spotify users how much more the artists they listened to would be paid if they switched to Tidal or other platforms.


